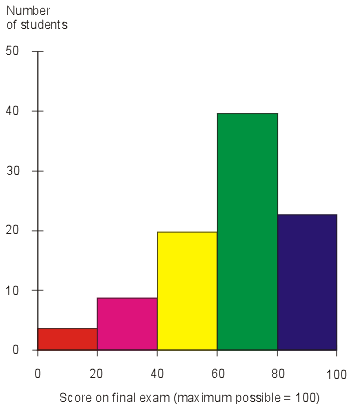
 This histogram is showing the results of a final exam given to a class of students. Each score range is denoted by a bar of a certain color. When histogram were compared with those of classes from other years that received the same test from the same professor, conclusion were drawn about intelligence changes among students over the years.
Wednesday, December 3, 2008
Histogram map
 This histogram is showing the results of a final exam given to a class of students. Each score range is denoted by a bar of a certain color. When histogram were compared with those of classes from other years that received the same test from the same professor, conclusion were drawn about intelligence changes among students over the years.
Subscribe to:
Post Comments (Atom)
No comments:
Post a Comment